 Aleksei Sviridkin
974c280699
## What this PR does

Adds two readings to the tenant node-join path, taken on either side of
the same wait the KVM counters already bracket: the runner VM kernel's
own `/proc/stat`, and the per-thread CPU time of the QEMU processes the
sandbox VMs run as.

Every CPU reading on this failure path has a subject inside the sandbox:
a cgroup, a tenant worker's threads, a sandbox node's own `/proc/stat`.
Each of them can say a guest was given its ticks while getting no work
done, and none can say what the layers above spent. That is where this
suite's own tax is paid. The sandbox nodes' guest time is charged to the
runner kernel as user time, and whatever the runner VM loses to the
machine hosting it is charged to nobody the sandbox can see, so a node
reporting `steal 0` and a node whose hypervisor was itself waiting look
identical from inside.

`/proc/stat` is not namespaced, so reading it from the sandbox container
reads the runner VM's kernel. That is the only place steal on that layer
appears, and it is read in one direction only: a steal that climbs
proves this runner VM was preempted, while a zero proves nothing,
because the column is filled only where the hypervisor exposes a
paravirt steal clock and nothing in the capture observes whether this
one does. The sandbox nodes a layer down can make the stronger claim,
since this repository starts them with `accel=kvm`; nobody here starts
the runner VM, so for this lane the answer is unknown until somebody
reads a non-zero.

The sandbox VMs are QEMU processes in the same PID namespace as the
shell driving the suite, so their threads are a local read too. What
that adds is not "which node is busy" on its own, since
`cozy_capture_sandbox_node_cpu_time` already reads each node's own
`/proc/stat` by name; it is that split *on the join window*, since the
existing collector samples twice across a twelve-second interval inside
the diagnostics block, after the join has already failed. Beyond the
window it adds the host-side accounting of each vCPU thread, what the
runner actually granted it, which no in-guest counter can report, and
QEMU's non-vCPU IO and worker threads, which no in-guest counter sees
either. It also names which node each process is, read from the
`srv<N>/qemu.pid` files the bringup already writes: a container pid
identifies nothing, and whether the starving guest is the control-plane
node or a worker-carrying one is the discriminating question. With no
usable pid file the capture stays anonymous and says so, as its KVM
sibling does; the pid reads themselves are bounded like every other read
here, since a pid file that never yields a byte must not hold the
capture.

Both are taken at the two points the KVM counters already use, for the
same reason: the values are cumulative, so a rate needs a pair, and the
interval worth measuring is the window the guest is failing to boot in
rather than a few seconds after the deadline has expired. The thread
reading runs the probe the tenant worker capture already uses rather
than a copy of it, because that probe already answers the two outcomes
that matter here and already names the three ways it can come up short,
and a second copy would drift from it exactly at those failure paths.

Each capture carries the layer it describes in its own legend. Three
kernels in this report publish a `/proc/stat` and two captures now read
QEMU threads, one layer apart in each direction, so a reader who takes
one for the other is comparing a hypervisor against its own guest. The
runner-kernel legend also carries the trap specific to that layer:
nearly all of its user time IS guest time, because running the sandbox
VMs is what that kernel does, so adding the two columns double-counts
the whole run.

Cost and blast radius: two bounded local reads per sample, no cluster
access, nothing added to any diagnostics-phase budget window. The
failure-path calls sit behind the same reasoning as the KVM reading,
which the phase-budget guard in
`hack/run-kubernetes-node-join_test.bats` now prices with a cost arm for
each; the guards that enumerate collectors (the missing-`timeout`
warning and the documented spend order) carry both new names.

Tests are in `hack/run-kubernetes-runner-cpu_test.bats`, 44 cases, green
under both runner forms. They cover the readings themselves, every
legend claim a reader depends on, the bounded read and its knobs, the
sample-number split, each way a capture can come up empty (a file with
no `cpu` row, a container with no QEMU, a proc mount that yields
nothing, a QEMU named and then gone), the routing of a message from a
read that succeeded against one that failed, the per-node attribution
and each way it can be incomplete, and placement guards of their own:
both pairs must bracket the wait on both paths, nothing may be inserted
between the three second readings, and each collector must report a
shortfall to the job log in its own words rather than only to the
report, since one call site is the passing path where the artifact is
the one nobody downloads. Two guards exist because a legend can fail
without any number being wrong: one asserts that the
parse-from-the-last-parenthesis rule the legend states actually works on
the lines the capture holds, and one that every bracketed legend line
lands as a single line, since an apostrophe inside one of these
single-quoted strings shreds it into one word per line while still
passing any short grep.

No documentation change: the KVM pair this mirrors is not described in
`docs/agents/e2e-testing.md` either, and its documentation lives in the
legends the captures carry.

Context: #3513

### Screenshots

No UI changes.

### Downstream repositories

One line of the bringup changes too: `hack/e2e-prepare-cluster.bats` now
starts each sandbox QEMU with `-name guest=srv<N>,debug-threads=on`.
QEMU names vCPU threads (`CPU N/KVM`) only when asked to, so without the
flag every thread reports the bare process name and the vCPU/IO split
this capture documents would not exist to read on this lane; a test pins
the flag to the legend that relies on it.

Walked the trigger map in `docs/agents/contributing.md` against the
diff. Of the `hack/` triggers it names, `hack/e2e-prepare-cluster.bats`
(ansible-cozystack, talm) is touched: the touched lines are the CI
sandbox QEMU flags, which neither downstream repository restates -- both
provision real machines, not the e2e sandbox. `hack/package.mk`,
`hack/update-crd.sh` and `hack/upload-assets.sh` are untouched. The rest
of the change is confined to the Chainsaw kubernetes suites' shared
library and its unit tests, which no downstream repository restates.

- [x] No downstream repository is affected by this change
- [ ] [cozystack/website](https://github.com/cozystack/website) -
follow-up:
- [ ]
[cozystack/terraform-provider-cozystack](https://github.com/cozystack/terraform-provider-cozystack)
- follow-up:
- [ ]
[cozystack/ansible-cozystack](https://github.com/cozystack/ansible-cozystack)
- follow-up:
- [ ] [cozystack/ccp](https://github.com/cozystack/ccp) - follow-up:
- [ ] [cozystack/talm](https://github.com/cozystack/talm) - follow-up:
- [ ] [cozystack/cozyhr](https://github.com/cozystack/cozyhr) -
follow-up:
- [ ] [cozystack/cozy-proxy](https://github.com/cozystack/cozy-proxy) -
follow-up:
- [ ]
[cozystack/cozystack-telemetry-server](https://github.com/cozystack/cozystack-telemetry-server)
- follow-up:
- [ ]
[cozystack/external-apps-example](https://github.com/cozystack/external-apps-example)
- follow-up:
- [ ] [cozystack/examples](https://github.com/cozystack/examples) -
follow-up:

### Release note

```release-note
test(e2e): a tenant node-join failure now records the runner kernel's own CPU time and the sandbox VMs' per-thread QEMU CPU time on either side of the join wait, so steal on the layer above the sandbox and an uneven split across the three nodes are both visible in cozyreport.tgz
```


Cozystack
Cozystack is a free platform and framework for building clouds.
Cozystack is a CNCF Sandbox Level Project that was originally built and sponsored by Ænix.
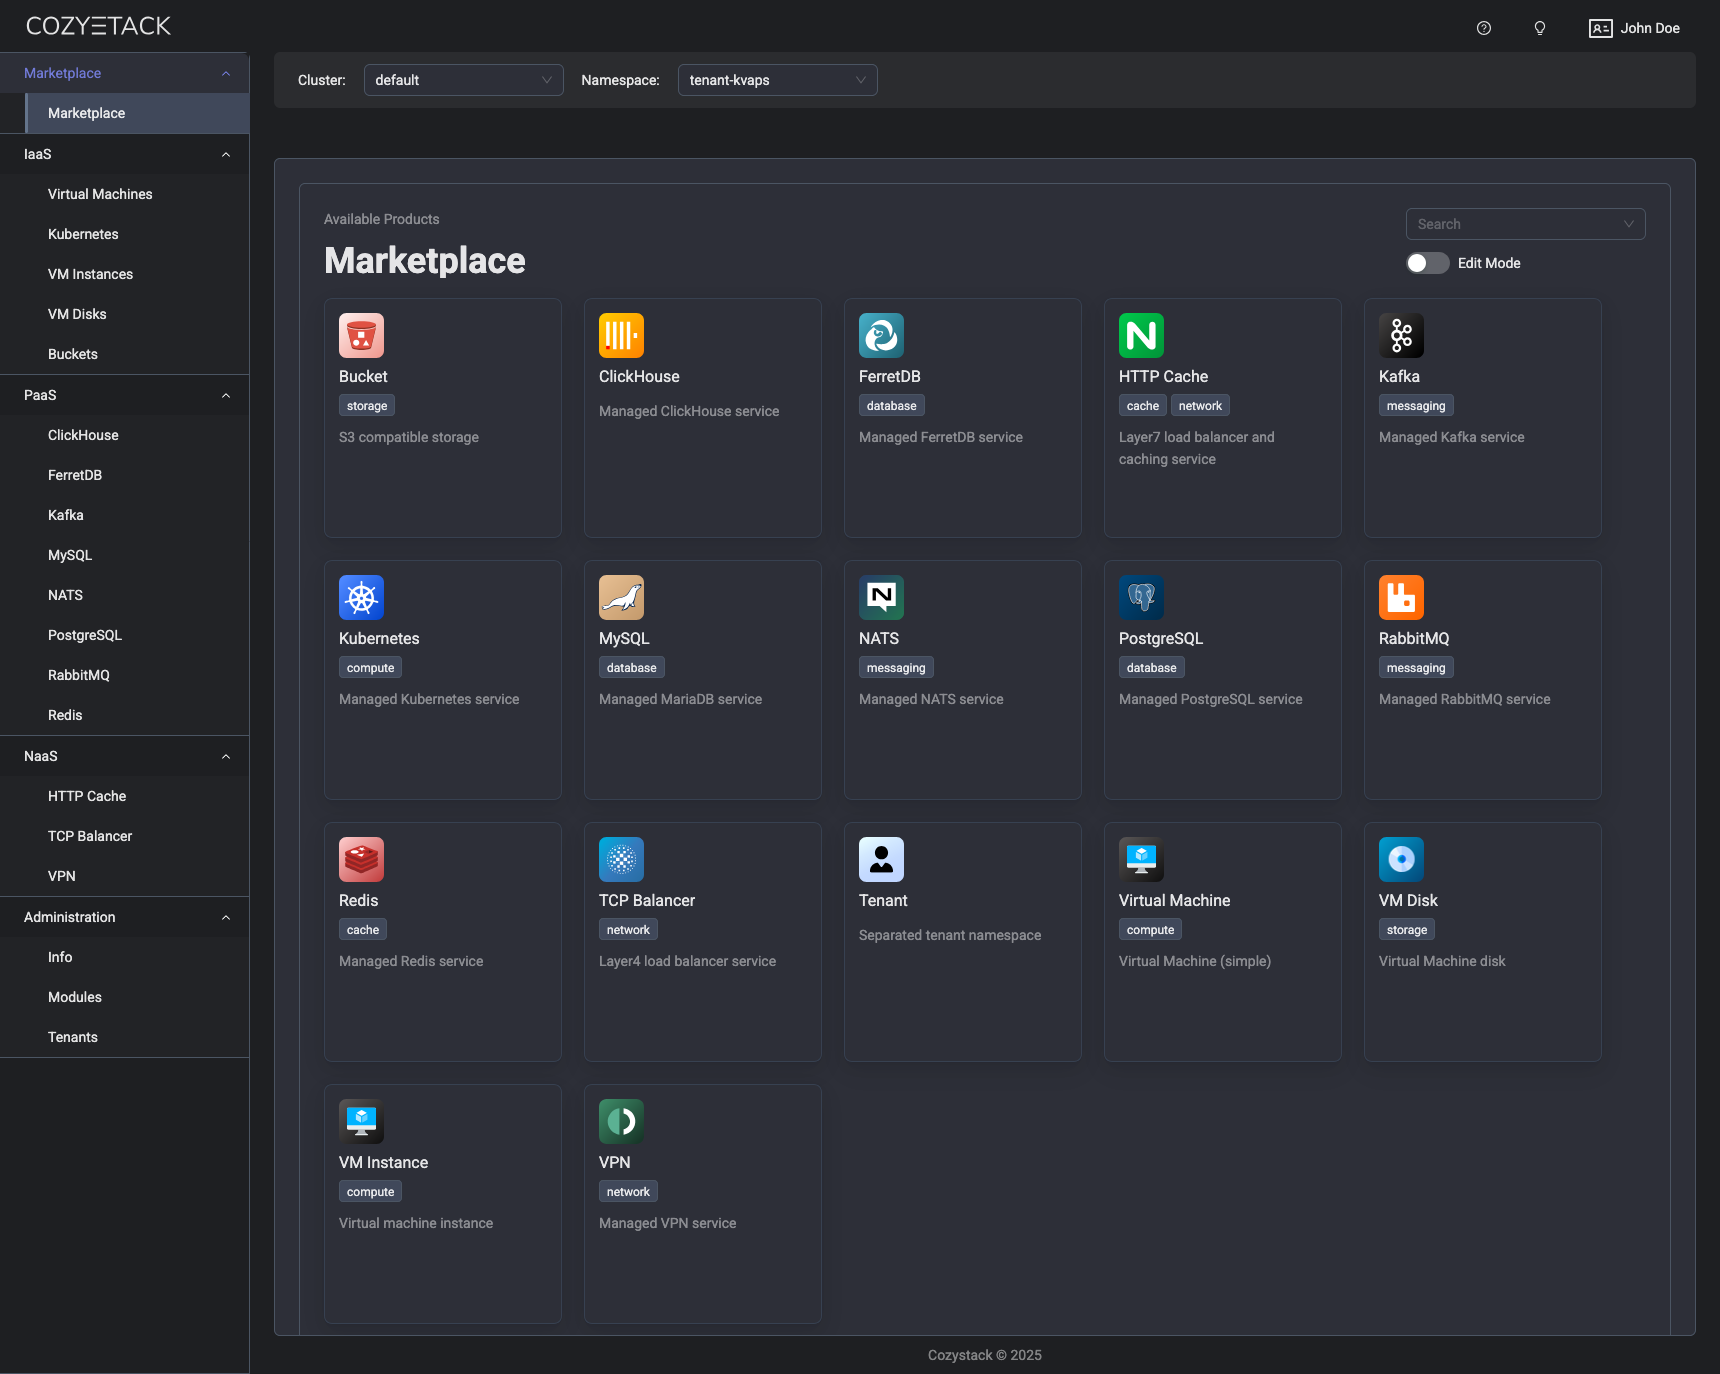
With Cozystack, you can transform a bunch of servers into an intelligent system with a simple REST API for spawning Kubernetes clusters, Database-as-a-Service, virtual machines, load balancers, HTTP caching services, and other services with ease.
Use Cozystack to build your own cloud or provide a cost-effective development environment.
Use-Cases
-
Using Cozystack to build a public cloud
You can use Cozystack as a backend for a public cloud -
Using Cozystack to build a private cloud
You can use Cozystack as a platform to build a private cloud powered by Infrastructure-as-Code approach -
Using Cozystack as a Kubernetes distribution
You can use Cozystack as a Kubernetes distribution for Bare Metal
Documentation
The documentation is located on the cozystack.io website.
Read the Getting Started section for a quick start.
If you encounter any difficulties, start with the troubleshooting guide and work your way through the process that we've outlined.
Versioning
Versioning adheres to the Semantic Versioning principles.
A full list of the available releases is available in the GitHub repository's Release section.
Contributions
Contributions are highly appreciated and very welcomed!
In case of bugs, please check if the issue has already been opened by checking the GitHub Issues section. If it isn't, you can open a new one. A detailed report will help us replicate it, assess it, and work on a fix.
You can express your intention to on the fix on your own. Commits are used to generate the changelog, and their author will be referenced in it.
If you have a concrete feature request, open an issue. For a cross-cutting or architectural change, open a design proposal in the community repo. For questions or early ideas, use GitHub Discussions. See CONTRIBUTING.md for the full routing.
Community
You are welcome to join our Telegram group and come to our weekly community meetings. Add them to your Google Calendar or iCal for convenience.
License
Cozystack is licensed under Apache 2.0.
The code is provided as-is with no warranties.
Commercial Support
A list of companies providing commercial support for this project can be found on official site.