 Aleksei Sviridkin
c3247c0ca0
## What this PR does

Every CPU reading this suite takes on a failing node-join describes a
subject inside the sandbox: a cgroup, a QEMU thread, a sandbox node's
own `/proc/stat`. All of them can report a guest that was handed its
ticks while the guest gets no work done, and none of them can say what a
tick cost. That is the state the node-join failures are in now, with
quota untouched, throttling near zero, steal at zero and the sandbox
host between a third and two thirds idle, while the guest does several
times less work per core than the same image does on a run that passes.

The price is paid one layer down. A tenant worker is a guest of a
sandbox node, which is itself a guest of the runner, and the runner's
kernel absorbs the exits, nested page faults and TLB flushes that the
arrangement provokes. That kernel publishes the totals in debugfs, and
the suite runs in a container sharing it, so this is a local read rather
than a walk over nodes.

Being local is what makes it affordable. The budget guard in
`hack/run-kubernetes-node-join_test.bats` computes both sides of its own
inequality, and on this tree the sampling pair can overshoot by 662s
against the 680s the derivation allows, which leaves 18 seconds of room.
A per-node reading costs two samples times three nodes times the read
bound and its kill grace, or 150 seconds at today's knobs, and no
transport changes that: the cost sits in the number of per-node calls
rather than in the number of counters. Reading the layer the sandbox
shares with the runner costs one bounded read instead, and takes nothing
away from the collectors already there.

debugfs is mounted in a mount namespace belonging to the call. The suite
runs for another twenty minutes after this returns, and a mount left
behind would be a diagnostic editing the environment the rest of the run
measures.

The pair is taken across the node-join wait rather than inside the
diagnostics block. A counter here accumulates over the life of the VM it
belongs to, so one reading is an average over that life rather than a
rate over anything; taking the first before the wait and the second
after it makes the interval a difference divides by the window the guest
was failing to boot in, instead of a few seconds after the deadline had
already expired. The kernel-wide files add a wrinkle the artifact states
beside the numbers: the kernel answers them by summing over the VMs
alive at the moment of the read, so a VM that went away between the
samples takes its whole contribution with it while the survivors keep
accumulating. The difference is then understated by a whole VM life and
its sign proves nothing when positive; when it does come out negative,
that is a finding about the sandbox rather than a rate.

The second reading is taken on the passing path too, so a green run
leaves a baseline to read the failing ones against, and it is taken
immediately after the wait rather than at the end of the run. That
placement is the measurement: the happy-path tail is another ten to
fifteen minutes of a tenant cluster doing storage and LoadBalancer work,
so a reading taken after it would price a different window over a
different workload while the capture's legend says it priced the join,
and the green-versus-red comparison the collector exists for would be
gone. A guard in `hack/run-kubernetes-node-join_test.bats` pins both
calls to either side of the wait and fails if either drifts.

What the capture cannot answer is written into the artifact rather than
left for a reader to assume. The counters price the sandbox VMs' own
execution and not what runs inside them. A per-VM directory is named
after a pid in the kernel's initial namespace, which the container
cannot map to its own processes, so the split says how evenly the
sandbox VMs paid and not which node paid what. Several counters sitting
in that same directory are gauges or running maxima rather than
cumulative, so a difference of those is a number with no meaning. And
there is no `ept_violation` counter to look for: the nested-paging
faults are counted as `pf_taken` and `pf_fixed`, under those names
whichever vendor the runner turns out to be.

Every branch that can come up short is named where a reader will look
for it: no `unshare` or no `mount` on PATH, a mount the sandbox refused,
a kernel whose debugfs holds no `kvm` directory at all (which would be a
finding about how the sandbox VMs are being run, not a collector that
failed), a `kvm` directory holding nothing readable, a walk the wrapper
cut short, and a report directory that could not be created. The pairing
instruction rides only on the arm that holds a whole reading, so the
artifact never invites a difference against a file that has no counters
in it.

A capture holding no counter answers its caller non-zero, the two
findings included, so the passing path writes the shortfall into the job
log instead of leaving it in a report nobody downloads. A walk cut short
after it wrote counters does not: it left a usable partial reading,
marked as partial, and telling the caller nothing was collected would
contradict the file sitting beside it. That distinction is decided by
whether a counter reached the file rather than by whether the file has
bytes in it, because the walk writes a heading before it reads anything.

Covered by `hack/run-kubernetes-kvm-exits_test.bats`, which runs under
`make unit-tests`. The guards in
`hack/run-kubernetes-node-join_test.bats` that enumerate the collectors
were updated rather than worked around: the new capture gets a cost arm
in the budget guard, an entry in the missing-timeout warning, and an
explicit exemption from the spend-order list, because it is not behind
the phase gate. It is not behind that gate deliberately: every other
collector the phase declines loses only itself, while declining this one
would orphan a reading already taken eighteen minutes earlier. Two
guards there are new: one pins where the two readings sit rather than
what they contain, the other pins that both call sites consume the
collector's status, since this is the only collector in that file whose
return value is read at all and it is read so a passing run's shortfall
reaches the job log.

The collector is also stubbed in that suite, at the shared helper and at
each of the five inline stub lists inside its `bash -c` bodies. Left out
of them the node-join unit tests call it for real, which on Linux means
the unit suite runs `unshare --mount` and `mount -t debugfs` with
whatever privileges the host gives it, while on macOS the collector
stops at its own `command -v unshare` precondition and the path is never
exercised at all: a unit test whose result is set by the machine rather
than by the code. Measured with a recording fake on `PATH`, the suite
makes 21 real invocations with no stub, 9 with the shared helper alone,
and none with every site covered. Stubbing costs the block-level read
audit nothing, because that audit works by letting real collector bodies
reach the kubectl mock and this collector issues no kubectl read.

Context for the measurement is cozystack/cozystack#3513.

### Screenshots

Not a UI change.

### Downstream repositories

I walked the trigger map in `docs/agents/contributing.md` against the
diff. The diff adds one collector to
`hack/e2e-chainsaw/_lib/run-kubernetes.sh`, adds one BATS suite under
`hack/`, and edits guards in an existing BATS suite. Nothing under
`hack/` is moved or renamed, no make target changes what it does, and
`hack/e2e-prepare-cluster.bats` is not touched, so neither the `ccp`
trigger on `hack/` layout nor the `ansible-cozystack` and `talm`
triggers on node prerequisites fire.

- [x] No downstream repository is affected by this change
- [ ] [cozystack/website](https://github.com/cozystack/website) -
follow-up:
- [ ]
[cozystack/terraform-provider-cozystack](https://github.com/cozystack/terraform-provider-cozystack)
- follow-up:
- [ ]
[cozystack/ansible-cozystack](https://github.com/cozystack/ansible-cozystack)
- follow-up:
- [ ] [cozystack/ccp](https://github.com/cozystack/ccp) - follow-up:
- [ ] [cozystack/talm](https://github.com/cozystack/talm) - follow-up:
- [ ] [cozystack/cozyhr](https://github.com/cozystack/cozyhr) -
follow-up:
- [ ] [cozystack/cozy-proxy](https://github.com/cozystack/cozy-proxy) -
follow-up:
- [ ]
[cozystack/cozystack-telemetry-server](https://github.com/cozystack/cozystack-telemetry-server)
- follow-up:
- [ ]
[cozystack/external-apps-example](https://github.com/cozystack/external-apps-example)
- follow-up:
- [ ] [cozystack/examples](https://github.com/cozystack/examples) -
follow-up:

### Release note

```release-note
test(e2e): capture the runner kernel's KVM exit counters on either side of the tenant node-join wait, so a node-join failure can be told apart from a nested-virtualisation slowdown that no counter inside the sandbox can see
```


Cozystack
Cozystack is a free platform and framework for building clouds.
Cozystack is a CNCF Sandbox Level Project that was originally built and sponsored by Ænix.
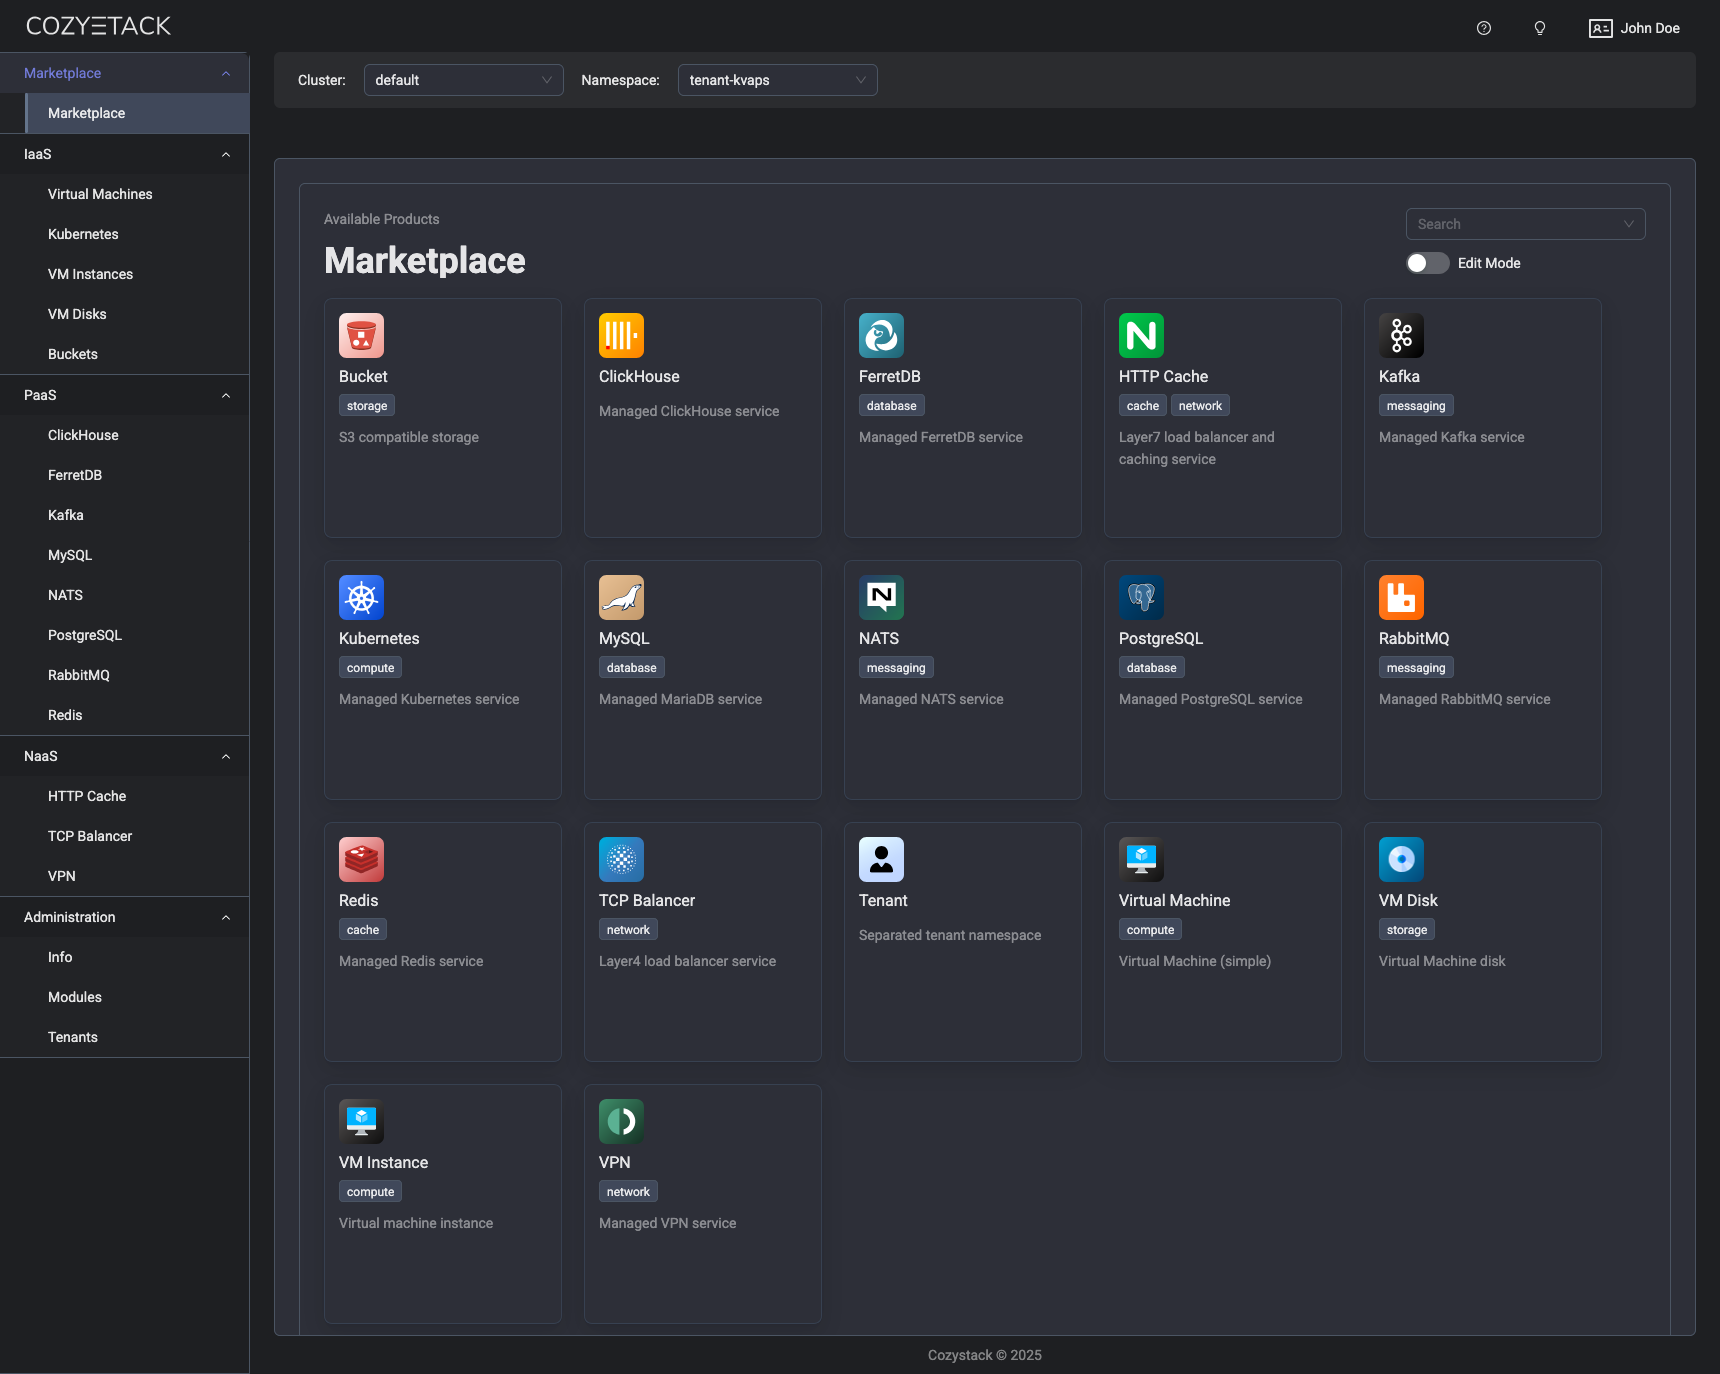
With Cozystack, you can transform a bunch of servers into an intelligent system with a simple REST API for spawning Kubernetes clusters, Database-as-a-Service, virtual machines, load balancers, HTTP caching services, and other services with ease.
Use Cozystack to build your own cloud or provide a cost-effective development environment.
Use-Cases
-
Using Cozystack to build a public cloud
You can use Cozystack as a backend for a public cloud -
Using Cozystack to build a private cloud
You can use Cozystack as a platform to build a private cloud powered by Infrastructure-as-Code approach -
Using Cozystack as a Kubernetes distribution
You can use Cozystack as a Kubernetes distribution for Bare Metal
Documentation
The documentation is located on the cozystack.io website.
Read the Getting Started section for a quick start.
If you encounter any difficulties, start with the troubleshooting guide and work your way through the process that we've outlined.
Versioning
Versioning adheres to the Semantic Versioning principles.
A full list of the available releases is available in the GitHub repository's Release section.
Contributions
Contributions are highly appreciated and very welcomed!
In case of bugs, please check if the issue has already been opened by checking the GitHub Issues section. If it isn't, you can open a new one. A detailed report will help us replicate it, assess it, and work on a fix.
You can express your intention to on the fix on your own. Commits are used to generate the changelog, and their author will be referenced in it.
If you have a concrete feature request, open an issue. For a cross-cutting or architectural change, open a design proposal in the community repo. For questions or early ideas, use GitHub Discussions. See CONTRIBUTING.md for the full routing.
Community
You are welcome to join our Telegram group and come to our weekly community meetings. Add them to your Google Calendar or iCal for convenience.
License
Cozystack is licensed under Apache 2.0.
The code is provided as-is with no warranties.
Commercial Support
A list of companies providing commercial support for this project can be found on official site.