 Aleksei Sviridkin
66cd0fbe89
## What this PR does

A tenant worker's guest serial console is stamped in seconds since that
guest's own kernel started. So a log that ends mid-boot tells you how
far the guest got and nothing at all about when that was. Whether it
ends there because the guest started late or because the guest stopped
printing is the difference between two unrelated failures, and neither
instant was written down anywhere: the read's own instant was nowhere in
the file, surviving only as the artifact's mtime, which is metadata
rather than content and so says nothing to anyone who opens the log, and
the guest's start only inside a `describe` dump that the capture
triggers exclusively when some console came back silent. On a run where
every console returned bytes, that dump does not exist.

I went looking for the answer in three collected reports before changing
anything. Every one of the twelve captures across them exited zero, so
no read was truncated by its 30s bound or by `--limit-bytes`, and the
logs are 23 to 79 KB against a 1 MiB cap. The captures stop at 305, 370,
432, 456, 474, 497, 564, 570, 583, 599 and 639 guest seconds. A fixed
cutting mechanism does not produce a 334 second spread. The logs end
where the guests stopped printing. On the single worker where both ends
were recoverable at all, by reading the file's mtime and the describe
together, the guest had been alive for 955 seconds and had printed up to
second 564.

Each console log now carries the instant its own read started and
returned, and `CAPTURE-TIMELINE.txt` beside it carries each Pod's phase,
its start time and the start of its compute and console containers, from
one bounded read taken once for the whole selector rather than per Pod.
Those two subtract to how long a guest had been alive when it was read,
which is what the log's last kernel stamp gets compared against. Close
together means the guest was still printing and the log ends because it
had not got further. Far apart means it stopped. A Pod with no compute
start never ran a guest at all, whatever its console file says. The
legend in the file names the units on both ends, because an epoch
integer and an RFC 3339 string subtract to nonsense if you take them as
printed. A read that failed and a read that answered with nothing are
written down as themselves instead of leaving an absent file.

The same capture now also runs on the passing path, after the last
assertion and before the tenant is deleted, because the container
holding the stream goes with the Pod and no read recovers it afterwards.
Every console this tree has collected came from a failure, so nobody has
ever measured what a healthy boot looks like, while "slower than usual"
is the claim the node-join failure keeps resting on. That caller asks
for the pool's minimum rather than its maximum, since two workers
booting is the same measurement as ten, and it warns in the job log
instead of failing a suite that has already proved everything it exists
to prove. Both paths write the same directory, so the capture records
which of them produced it.

The cost moves by one bounded read. The serial console family goes from
roughly 5m50s to 6m25s at worst and from 3m30s to 4m05s at the pool
minimum, both against the 7m diagnostics phase budget, and the figure in
both suite comments moves with it under the guard that holds the two in
step. The passing path adds six bounded reads at 30s and 5s kill grace,
so 210s.

That 210s is real wall clock at the tail of an operation with a fixed
50m ceiling, which is a way for a run that already passed to be killed
while collecting a debugging aid. So the passing-path capture declines
itself out loud when the ceiling no longer has room for it, against a
reserve derived from its own cost plus the deletes after it. The ceiling
it measures against is read from both sides by a guard, so a suite that
changes its `timeout:` fails there rather than leaving the reserve
protecting a number that moved.

What this deliberately does not do is widen a capture window. I could
not derive a number for one that would be honest. The reads are already
complete, so there is no read side bound to relax, and the only
remaining lever is waiting longer before reading. How much longer
depends on whether the tail silence is the guest freezing or the stream
stopping, and that is precisely what was not measurable. The evidence
leans toward the guest: the logs end on complete lines, and one of them
ends on an RCU stall backtrace, which is the kernel reporting it was not
being scheduled. If that holds, the silence has no ceiling and no fixed
window can promise to contain a milestone. The green baseline this adds
is what would set the number, and it does not exist yet.

Context for cozystack/cozystack#3513, which this does not fix. It
restores the instrument that investigation needs.

### Screenshots

Not a UI change.

### Downstream repositories

I walked the trigger map in `docs/agents/contributing.md` against the
actual diff. It touches `docs/agents/e2e-testing.md`, the shared e2e
helper `hack/e2e-chainsaw/_lib/run-kubernetes.sh`, the two
`kubernetes-*` suite files and three unit test files under `hack/`.
Nothing under `packages/`, no `ApplicationDefinition`, no values schema
or enum or default, no namespace, no emitted metric, no label or
annotation another component reads, no node prerequisite in
`hack/e2e-prepare-cluster.bats`, no make target and no file moved or
renamed under `hack/`. No trigger in the map matches.

- [x] No downstream repository is affected by this change
- [ ] [cozystack/website](https://github.com/cozystack/website) -
follow-up:
- [ ]
[cozystack/terraform-provider-cozystack](https://github.com/cozystack/terraform-provider-cozystack)
- follow-up:
- [ ]
[cozystack/ansible-cozystack](https://github.com/cozystack/ansible-cozystack)
- follow-up:
- [ ] [cozystack/ccp](https://github.com/cozystack/ccp) - follow-up:
- [ ] [cozystack/talm](https://github.com/cozystack/talm) - follow-up:
- [ ] [cozystack/cozyhr](https://github.com/cozystack/cozyhr) -
follow-up:
- [ ] [cozystack/cozy-proxy](https://github.com/cozystack/cozy-proxy) -
follow-up:
- [ ]
[cozystack/cozystack-telemetry-server](https://github.com/cozystack/cozystack-telemetry-server)
- follow-up:
- [ ]
[cozystack/external-apps-example](https://github.com/cozystack/external-apps-example)
- follow-up:
- [ ] [cozystack/examples](https://github.com/cozystack/examples) -
follow-up:

### Release note

```release-note
test(e2e): stamp each tenant worker guest console capture with the instant it was read and the instant its guest started, and take the same capture on passing runs so a failing boot has a healthy one to be compared against
```


<!-- This is an auto-generated comment: release notes by coderabbit.ai
-->

## Summary by CodeRabbit

* **Diagnostics**
* Improved Kubernetes serial-console diagnostics with capture context,
bounded collection, per-read timestamps, and cluster-wide Pod start-time
timelines.
* Added clearer reporting for incomplete, unavailable, or failed
diagnostic data.
* Added absolute timestamps and explicit time units to support reliable
troubleshooting.

* **Reliability**
* Passing test runs now collect baseline diagnostics only when
sufficient time remains, helping prevent suite timeouts.

* **Tests & Documentation**
* Expanded diagnostic coverage and updated documented timing
expectations for supported Kubernetes versions.

<!-- end of auto-generated comment: release notes by coderabbit.ai -->


Cozystack
Cozystack is a free platform and framework for building clouds.
Cozystack is a CNCF Sandbox Level Project that was originally built and sponsored by Ænix.
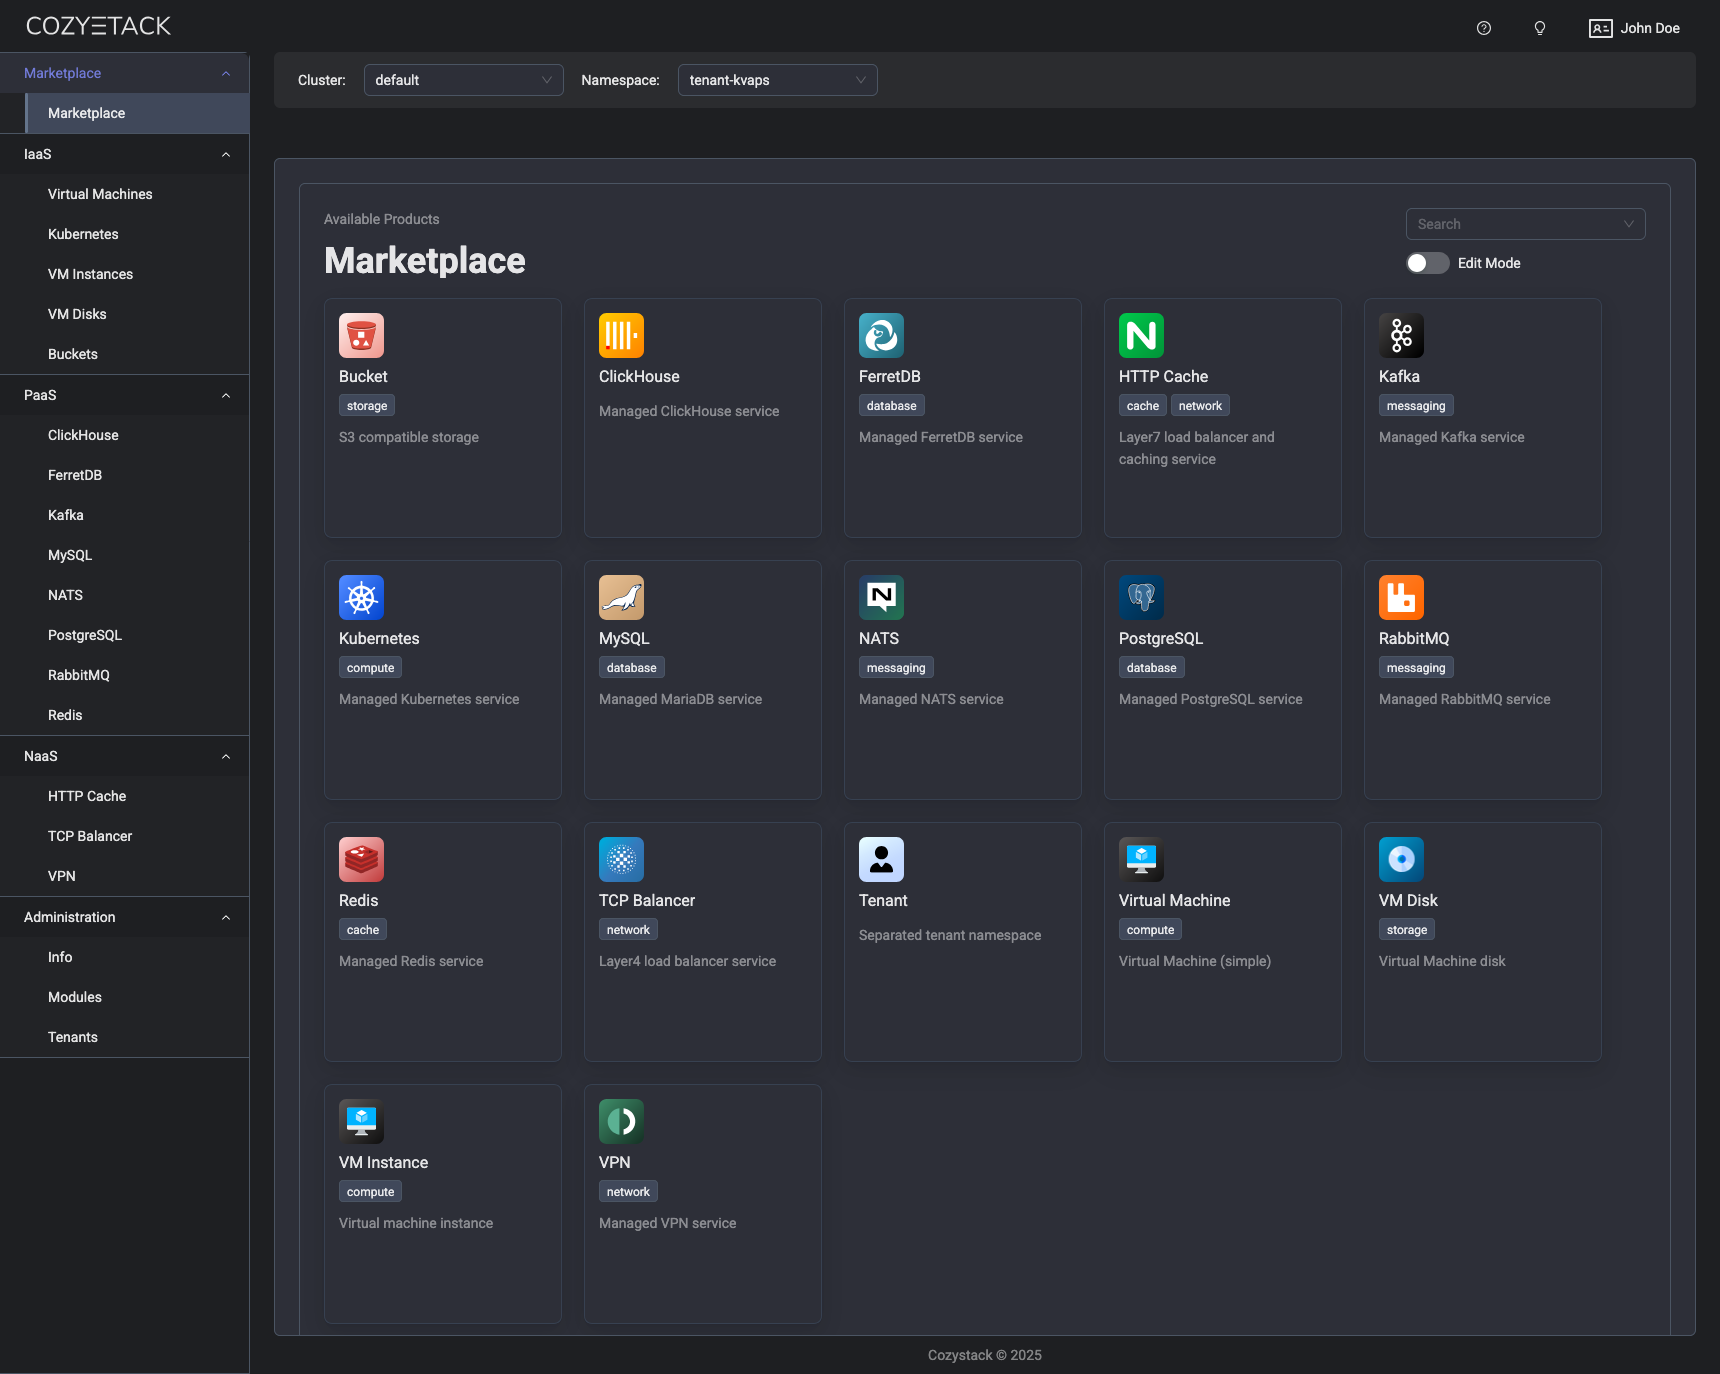
With Cozystack, you can transform a bunch of servers into an intelligent system with a simple REST API for spawning Kubernetes clusters, Database-as-a-Service, virtual machines, load balancers, HTTP caching services, and other services with ease.
Use Cozystack to build your own cloud or provide a cost-effective development environment.
Use-Cases
-
Using Cozystack to build a public cloud
You can use Cozystack as a backend for a public cloud -
Using Cozystack to build a private cloud
You can use Cozystack as a platform to build a private cloud powered by Infrastructure-as-Code approach -
Using Cozystack as a Kubernetes distribution
You can use Cozystack as a Kubernetes distribution for Bare Metal
Documentation
The documentation is located on the cozystack.io website.
Read the Getting Started section for a quick start.
If you encounter any difficulties, start with the troubleshooting guide and work your way through the process that we've outlined.
Versioning
Versioning adheres to the Semantic Versioning principles.
A full list of the available releases is available in the GitHub repository's Release section.
Contributions
Contributions are highly appreciated and very welcomed!
In case of bugs, please check if the issue has already been opened by checking the GitHub Issues section. If it isn't, you can open a new one. A detailed report will help us replicate it, assess it, and work on a fix.
You can express your intention to on the fix on your own. Commits are used to generate the changelog, and their author will be referenced in it.
If you have a concrete feature request, open an issue. For a cross-cutting or architectural change, open a design proposal in the community repo. For questions or early ideas, use GitHub Discussions. See CONTRIBUTING.md for the full routing.
Community
You are welcome to join our Telegram group and come to our weekly community meetings. Add them to your Google Calendar or iCal for convenience.
License
Cozystack is licensed under Apache 2.0.
The code is provided as-is with no warranties.
Commercial Support
A list of companies providing commercial support for this project can be found on official site.